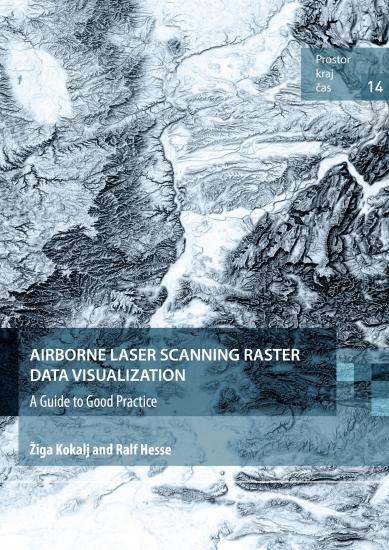
Airborne laser scanning raster data visualization. A Guide to Good Practice.


Authors: Ralf Hesse, Žiga Kokalj
Year: 2017


This guide provides an insight into a range of visualization techniques for high-resolution digital elevation models (DEMs). It is provided in the context of investigation and interpretation of various types of historical and modern, cultural and natural small-scale relief features and landscape structures. It also provides concise guidance for selecting the best techniques when looking at a specific type of landscape and/or looking for particular kinds of forms.
The three main sections – descriptions of visualization techniques, guidance for selection of the techniques, and visualization tools – accompany examples of visualizations, exemplar archaeological and geomorphological case studies, a glossary of terms, and a list of references and recommendations for further reading. The structure facilitates people of different academic background and level of expertise to understand different visualizations, how to read them, how to manipulate the settings in a calculation, and choose the best suited for the purpose of the intended investigation.
A smaller amount of books is also available in hardcover (ISBN 978-961-05-0011-7, 24 EUR).


Table of content

1 Introduction to the Guide
      1.1      Aim and scope of this guide
      1.2      How to use the guide
      1.3      Applications of lidar visualizations
      1.4      Free data access
2 Description of techniques
      2.1      Analytical hillshading and hillshading from multiple directions
      2.2      Slope
      2.3      Elevation differentiation
      2.4      Trend removal and local relief model
      2.5      Sky-view factor and anisotropic sky-view factor
      2.6      Openness
      2.7      Local dominance
      2.8      Cumulative visibility
      2.9      Accessibility
      2.10    Multi-scale integral invariants (MSII)
      2.11    Laplacian-of-Gaussian (LoG)
      2.12    Visualizing uncertainty
3 Guidance for selection of techniques
      3.1      Preparing the images for detection and interpretation
      3.2      Reading and presenting the images
         3.2.1     Choosing appropriate visualisations
         3.2.2     Personal preferences and intercomparability
         3.2.3     Perception
      3.3      Visualization of datasets other than lidar
      3.4      What’s in a name?
4 Tools
      4.1      Relief Visualization Toolbox (RVT)
      4.2      Lidar Visualisation Toolbox (LiVT)
5 Case studies
      5.1      WWII anti-glider defences at Culbin, Scotland
      5.2      Hollow ways at Volčji Potok, Slovenia
      5.3      Prehistoric and Roman settlement above Knežak, Slovenia
      5.4      Barrow cemetery in Pivola, Slovenia
      5.5      Alluvial fan at Craig canyon, Saline Valley, California, USA
      5.6      Geological features in the Julian Alps, Slovenia
      5.7      The Granite Dells, USA
      5.8      Cinder cones and lava flows on Mauna Loa, Hawaii, USA
      5.9      Blind valley Odolina, Slovenia
      5.10    Lake floor morphology, Lake Constance, Germany, Switzerland, and Austria
      5.11    High-rise buildings in New York,
Glossary of terms and abbreviations
Bibliography and further reading
List of figures
List of tables


More ...


price
sold out


Keywords
case studies
digital heights model
geodetic measurements
geodetic methods
geographical typology
landscapes
laser scanning
laser techniques
lidar
manuals
relief forms
remote sensing
settings
spatial data
technics
tools
visualization


Options

Add to favorites

Print

Send by e-mail

QR